Wednesday, 30 June 2010

Investment Idea - Archer Daniels Midland Company (ADM)

Archer Daniels Midland Company
Ticker:: ADM
Sector: Consumer/Non-Cyclical
Listing: NYSE

Introduction

ADM is a one of the leading global processors of agricultural commodities such as oilseeds, corn, cocoa and wheat. The firm is a leading manufacturer of food and feed ingredients such as vegetable oil, corn, biodiesel, ethanol and flour. The company has a grain elevator and an extensive transportation network to procure, store, clean, and transport agricultural commodities. It also has operations in 32 countries across six continents.

Analysis

EPS has been quite low between 1998 and 2004. Afterwards, it has gone up significantly partially due to a increase in demand for bio fuels, since the governments want to reduce emissions from vehicles. Again, the recession has affected earnings in 2008 and 2009. However, the firm has not made a loss in the past ten years.


EPS growth has been a little inconsistent. However, the average growth is 20.06%.


Return on Equity (ROE) has increased generally between 1999 and 2007. The average is 9.69%. The ROE for 2009 is 12.65% which is above industry average of 8.48%. This suggests that the firm has competitive advantage over it's peers and it's extensive geographical and industrial operations reflect this. 


The firm is a dividend aristocrat member (1). Dividends has increased since 1977 (2).


Dividend yield has gone up generally since 1999. There was a dip in 2006 due to increased investment on new opportunities.


Financial ratios as at the close of 22/6/2010 (3) (4):


Using the Value strategy, this stock satisfies all of the defensive criteria. This is because:
  1. The turnover is greater than $100 million. Importantly for a manufacturer, the firm's net current assets is greater than it's non-current liabilities. 
  2. Current ratio of 2.08 provides a good margin of safety in case of all current liabilities become due.
  3. Dividends have been paid since 1977.
  4. EPS has been strictly positive over the past ten years, that is, no loss has been made for that period.
  5. 10 year EPS growth using 3 year averages at the beginning and exceeds 1/3. Using EPS from 1998 to 2000 and 2007 to 2009, 10 year growth is astonishing 498.63%.
  6. P/BV is below 1.5.
  7. Average P/E over 3 years is below 15.
Conclusion

This stock is a very good buy in the long term and in this current economic climate.

Note

I will not be responsible for any losses incurred by investors through investing in this stock. Investing in the stock market may result in not getting their initial amount back.

The above data has provided by Edgar Online, except sources 1,2 and 4. 


Full disclosure: No positions in ADM.

Source:
  1. S&P500 retrieved 12/6/2010.
  2. Archer Daniels Midland Company - Dividend & Split History retrieved 30/6/2010.
  3. I-Metrix - Edgar Online retrieved 23/6/2010.
  4. Zacks Invesment Research - ADM: Archer Daniels Midland Co - Financial Overview retrieved 23/6/2010.

Saturday, 26 June 2010

Euro Debt Crisis - A New Hope?


UK's emergency budget was well received by the markets and the rating agencies. The latter have more confidence that the country will bring down it's borrowing within a reasonable time frame. Therefore, they decided to leave the country's AAA credit rating alone. However, this good news has been overshadowed by fears that the euro debt crisis may result in slower economic growth with some believing that it may lead the eurozone economy back into recession. The crisis may have an impact on the global economy which may lead to a double dip recession. This and worse than expected US home sales figures has spooked the markets sending share prices downwards. Lets hope that the G20 Summit will sort the problem out for once and all.

My portfolio went down more than the market in general, since the banks and oil companies were affected the most by the bad news. This shows that I am heavily exposed to the financial sector and that my portfolio needs rebalancing. This will take me quite a while to achieve equal exposure to each sector I choose to invest in. Taking a neutral view, the financial shares will eventually recover and I will receive dividends again. These dividends will aid my aim of portfolio rebalancing.

BP is still being affected by the oil spill and some US politicians want the company to file Chapter 11 so that the company can compensate the victims of the disaster. I believe that BP going bust is a hawkish US politician's dream because of the following:
  • even though the company's credit rating has been downgraded, it can still raise funds whenever it needs to
  • the company will still be very profitable after reduced investment and divestment of non-core assets
  • bankruptcy will lead to serious consequences in the economies where the firm has significant operations such as higher unemployment, slower economic growth and lower tax revenue [especially for the US regarding the latter], and
  • it still has the support of Goldman Sachs, important law firms and influential lobbyists, which will definitely, in my opinion, help it through the problems it faces such as Anadarko refusing to accept responsibility [it owns 25% of the site of the former Deepwater Horizon rig], publicity and legal costs.
I have published this article on Seeking Alpha. This is about my opinions on the article I have recently read on the This is Money website.

Note that I will only post portfolio reviews on the last Friday of each month because I want to dedicate more time to self development, conducting more research on potential investment gems and comment on various worthy articles I read.

Full disclosure: Long BP

Saturday, 19 June 2010

Will US make BP pay?


Worries over the euro debt situation have faded away a bit but this episode is not over yet. Other EU countries could have some skeletons in the cupboard. BP's Credit rating downgrades by Fitch and Standard & Poors and solvency worries have basically sent share prices down south big time initially. Then the good news regarding new UK banking reforms and BP's suspension of dividends for the rest of this financial year and set up of $20bn (£13bn) escrow fund sent the share prices back up. Also the euro worries possibly contributed to the rise. Overall, this week has been a bit exciting in terms of volatility because generally good economic news from the UK overshadowed by worse than expected news from the US.

Regarding BP, I updated my analysis on Seeking Alpha taking into account of recent events. I still believe that the company does represent a good investment in the long term though some uncertainties still exist, namely the time required to plug the leaking well and total cost. 

The FTSE All-Share rose by 1.83% while my portfolio by 1.03%. The rise in the portfolio value was limited by falls in Norman Broadbent (NBB), which is the new name for GAR, and BP. My gain now stands at 0.35% (0.56% if additional holdings in NBB had not been bought). I think my eventual future gains will take a bit more time to become a reality because BP and the banks are out of favour. Therefore their share prices will eventually return to it's historical highs and it will happen again.

Full disclosure: Long BP

Sunday, 13 June 2010

Investment Idea - British Petroleum (BP.)

British Petroleum
Ticker: BP.
Sector: Oil & Gas Producers
Listing: LSE


Introduction

BP conducts the following activities; exploration, extraction and transportation of oil & gas, refines crude oil into a wide range of products, conducts sales through forecourts, supplies fuel and generates low carbon energy in the form of non-renewables and renewables. The firm has operations in more than 80 countries across six continents.

Analysis

Over the past four years the EPS have remained flat.Rising energy prices as a result of increasing demand in part supported the near constant EPS level. BP's profits have fallen by 21.41% to $16.578 billion (EPS of 88.49c) for 2009 compared to the previous year. This is due to a fall in global demand for energy as a result of the worse economic recession since the Great Depression.


The EPS growth rate has dropped dramatically. This could be due to expansion of exploration operations away from it's core geographical areas, for example, into Russia. Also fluctuating energy prices throughout the period and the financial crisis is the cause of the drop from 2007 onwards. 


ROCE has been falling over the past five years. The exploration programs in new geographic areas and development of low carbon energy could be the reasons. However, the average ROCE is 26.51% so therefore the company has the potential to deliver good and probably superior returns in the long run.


Dividends have increased since 1993 with the exception of 2005. The average increase is 15.29%. This shows that the firm does have a good track record of raising the dividend year after year most of the time. Note that the dividend has increased by 8.91% from 32.39p in 2008 to 35.28p in 2009 suggesting that the management have the confidence that results would improve in the 2010 financial year. This with the chairman's statement in the 2009 annual does have an overall optimistic tone implying that the company will do well in the current financial year. However, I must take into account of the likely effects of the Gulf of Mexico oil spill on the company's near future profits. This includes but not limited to legal, clean-up and compensation costs. It's reputation will be damaged in the short term but the extent is very hard to measure. Only time will tell.


Financial ratios as at the close of 11/6/2010 (1):


Note that for P/CF, only positive values are used to calculate the sector average.

The financial ratios of all companies in the same sector as at the close of 11/6/2010 (1):

 
Using the contrarian strategy, the stock satisfies most of the criteria. This is because:
  1. The P/E, P/BV and P/CF are below sector average and within the two lowest quintiles.
  2. The dividend yield is above sector average and within the two highest quintiles.
  3. Dividend cover of 1.58 is below the desirable limit but above the mandatory limit. This implies that dividends could be cut or in the worse case scenario be suspended into the clean-up is complete. 
  4. The current ratio 0.72 is below the mandatory amount so it may be unable to repay all short term liabilities if they all become due simultaneously.
  5. With P/S of 0.45, it is below sector average and very cheap compared to it's peers. With a prospective PEG of 0.32 it is very good enough for a large cap. ROCE of 17.36%,the firm does have competitive advantage over it's peers (comparing against those with positive ROCE). Net gearing of 32.28% is not too high and the firm's strong cash flow should mean it can pay off it's liabilities all in one go without major problems.
  6. EPS growth of -21.41% is below that of FTSE100, which is about 5.1%.
  7. Future earnings growth forecasts do lean on the very conservative side and are unlikely to go down. Taking into account of the current situation, future growth will be revised downwards by analysts. Therefore, future EPS growth might be quite low for the current financial year. Note that the images below are taken from Digital Look for comparison purposes.


Conclusion

This stock is a very good buy the long term. In the very short term, it may be a little bumpy ride if the US state gets it's own way.

Note

I will not be responsible for any losses incurred by investors through investing in this stock. Investing in the stock market may result in not getting their initial amount back.

Full disclosure: Long BP.


Source:
  1. Digital Look retrieved 11/6/2010.


Saturday, 12 June 2010

Few want to friends with BP

Listed on the London Stock Exchange:

BP 391.90p +15.60p (+4.14%) - since purchase on 10/6/2010
BARC 290.85p +2.25p (+0.78%)
CAU 46.25p -1.75p (-3.65%)
CRWN 30.50p 0.00p (0.00%)
FPER 5.50p +0.12p (+2.23%)
FCCN 42.00p 0.00p (0.00%)
FOGL 201.50p +0.65p (+0.32%) - since purchase on 11/6/2010
GAR 3.38p 0.00p (0.00%)
JKX 240.40p +8.40p (+3.62%)
LLOY 54.33p -1.11p (-2.00%)
LLPE 59.75p 0.00p (0.00%)
MAI 153.50p -2.50p (-1.60%)
QQ. 119.80p -8.20p (-6.41%)
RBS 42.37p -1.12p (-2.58%)
UNG 2.88p +0.13p (+4.55%)

Listed on New York Stock Exchange:

C $3.88 +$0.09 (+2.37%)

The euro debt crisis never seems to go away for now since Hungary may be the next Greece. That, fears over levy on banks and BP's continuing problems sent the markets down earlier this week. Then it began to rise again due to mainly strong metal export data from China. Worse than expected US job and retail sales data interrupted the rise towards the end of the week a little bit but it was not enough to reverse the direction. Overall FTSE All-Share finished the week 0.78% up while my portfolio finished 0.68%, due to concerns of LLOY and RBS exposure to the euro debt crisis. The portfolio loss is now 3% (3.1% if BP (BP.) and Falkland Oil & Gas (FOGL) not included). 

On Wednesday rumours of BP's problems regarding the oil spill resulting the company going insolvent sent it's share price down 16% to 348p before recovering most of the loss on the same day. It seems that particular noisy information have caused this massive overreaction as traders and investors sold their stakes in huge numbers. I went in the opposite direction, that is, I bought some shares in the company near it's two year low.  At that point I realised that the stock may be a contrarian one since it's share price fell massively from around almost 660p. This is the preliminary analysis I have done so far on the stock as at the close of 11/6/2010:


The stock is within the lowest two quintiles for P/E, P/BV and P/CF. It is within the highest two quintiles for dividend yield. I will provide the full analysis about week from now.

I also bought shares in FOGL because there is a good probability of the firm, along with Rockhopper Exploration (RKH), finding economically viable oil north of the Falkland Islands based on very sound preliminary drilling test results.

Friday, 11 June 2010

Investment Idea - Qinetiq Group (QQ.)

Ticker: QQ.
Sector: Aerospace & Defence
Listing: LSE

Introduction

Qinetiq Group produces equipment for defence organisations, security agencies and intelligence services. Each product is designed to provides solutions to their clients' problems. It is also capable to produce a wide variety of equipment ranging from asset tracking to unmanned aerial vehicles. It has established presence in the UK, US, Europe and Australia.

Analysis

The firm has made a pre-tax loss of £66.1 million and loss after tax of £63.3 million for the 2010 financial year ending 31/03/2010. This is because the US and UK governments delayed orders for new equipment due to their huge budget deficits resulting from the financial crisis. Once divestment, disposal, impairment, reorganisation and amortisation costs from acquisitions are added to the loss after tax, the profit after tax is £72.8 million. However, the P/E is calculated using EPS of -9.3p (using loss of £63.3 million) is -13.25. P/E after the latter items added is 11.1. However, the EPS has gone up over the past four years before that latest results.


The cases are the same for dividend per share and dividend yield respectively.


Overall turnover has increased by 4.5% compared to the previous year with Mission Solutions and Systems Engineering contributing to the increase. The turnover from these businesses increased by 22.5% and 11.8% respectively with Technology Solutions QNA suffering a decrease of 25.7%. Funded orders have gone up overall by 3% which is contributed by Mission Solutions. This business had funded orders increase by 15.3% while the latter two decreased by 6.2% and 2.6% respectively. Net debt went down by 15% due to strong cash flow from its businesses and the weakening pound (since most of the debt is in US dollars).

There has been a change of management with the new chairman and CEO with effect on 1/3/2010 and 16/11/2009 respectively. Two new non-executive independent directors joined the board on 10/4/2010 with one stepped down on 4/8/2009.

A review, which is taken from (1), of the whole firm had taken place by the new CEO which has led to the following conclusions:
  • QinetiQ's rapid acquisition-based growth and its efforts to find applications for its intellectual property in new industrial markets have not created value for investors to date. The decision to enter the US market was sound, but returns as yet have been lower than expected and the Group's balance sheet has become over-stretched. Internally, the organisation has become fragmented and overly complex and its processes weak. Insufficient strategic focus and transparency have led to a high level of cost and loss-making activity. These issues, combined with external market conditions - which are likely to remain difficult while the UK and US Governments develop policies to address their spending and deficit challenges - have caused the Group's performance over recent years to fall below its potential
  • QinetiQ predominantly comprises service businesses, positioned to advise and support customers to achieve efficiency and effectiveness in their national markets. These businesses are based on - and continue to refresh - the deep domain and technical expertise of QinetiQ's people in the aerospace, defence and security sectors, and are capable of providing relatively stable and predictable income streams
  • The Group also possesses a smaller proportion of product businesses with differentiated technology offerings which have been developed in-house. These activities are capable of global application, but necessarily have a less predictable pattern of revenue generation and have been managed with insufficient commercialisation or sharing of intellectual property between the UK and US businesses.
In order to strengthen its foundations and build a future path to sustainable and profitable growth, QinetiQ must now:
  • Set a clear direction which reduces the span of focus and matches both customer needs and core QinetiQ strength
  • Simplify and align structure with this direction, removing unnecessary layers
  • Increase transparency and control through all levels
  • Upgrade leadership to ensure a commercial, value-oriented mindset
  • Create a strong performance culture of both accountability and empowerment in its people
  • Establish a lower level of cost base to enable future competitiveness
  • Ensure a more unified approach Group-wide to exploit key opportunities
  • Drive for cash generation to strengthen the Group's balance sheet
The firms goals, taken from (1), are:
  • Moving to a new structure comprising 3 divisions: US Services, UK Services and Global Products, to ensure efficient leverage of expertise, technology, customer relationships and business development skills
  • Introducing standardised management reporting and regular reviews of key business drivers such as talent, innovation, cost reduction and portfolio focus
  • Assessing the top leaders Group-wide, setting targets for performance and behaviours which reflect Group objectives for profit and cash, and providing appropriate incentives
  • Installing a Group-wide performance management system and increasing communication and engagement with employees to maximise their contribution, underpinned by a tracked and measured productivity programme
  • Rigorously examining business processes, key supplier contracts and, in the UK, legacy employee terms and conditions, to remove structural cost from the business to ensure competitiveness and enable investment in key opportunities
  • Introducing a unified QinetiQ approach which leverages existing assets to capitalise on global opportunities [this refers to imposing a unified corporate culture across the firm]
  • Eliminating loss-making activities and driving cash generation, including tight measurement of working capital, to reduce the gearing ratio to a target of below 2x+
  • Suspending payment of dividends on QinetiQ's Ordinary Shares for 12 months, with the intention of paying a final dividend with respect to the financial year ending 31 March 2011.
This indicates that the new members of the management have a clear direction they want the company to take. This in turn will lead to the firm producing good returns and value for it's shareholders in the long term.

Financial ratios as at the close of 7/6/2010 (2):


The financial ratios of all companies in the same sector as at the close of 7/6/2010 (2):


Using the contrarian strategy, the stock satisfies most of the criteria. In this case I will use P/BV as the core ratio. This is because:
  1. The P/BV and P/CF are below sector average and within the two lowest quintiles. The only exception is P/E since the firm has made a loss.
  2. Unfortunately, the dividend yield is below sector average since the firm has decided to suspend dividend payment for one year. However, it intends to pay a final dividend at the end of the current financial year.
  3. Dividend cover of 7.03 is greater than the desirable limit therefore the firm can sustain and increase above average yields once dividend payments resume.
  4. The current ratio 1.36 is above the minimum amount although it is not desirable.
  5. With P/S of 0.5, it is below sector average and very cheap compared to it's peers. With a prospective PEG of 0.8 it is good enough for a firm with market capitalisation greater than £300m even though it is above desirable limit of 0.66.
  6. Obviously the EPS growth is below that of FTSE100, which is about 5.1%.
  7. Future earnings growth forecasts do lean on the very conservative side and are unlikely to go down. Note that the images below are taken from Digital Look for comparison purposes.

Conclusion

This stock is a good buying the long term provided that the new members of the management perform better than expected

Note

I will not be responsible for any losses incurred by investors through investing in this stock. Investing in the stock market may result in not getting their initial amount back.

Full disclosure: Long QQ.

Source:

Saturday, 5 June 2010

Things are a bit volatile out there

Listed on the London Stock Exchange:

BARC 288.60p -16.50p (-5.41%)
CAU 48.00p +0.50p (+1.05%)
CRWN 30.50p 0.00p (0.00%)
FPER 5.38p +0.13p (+2.48%)
FCCN 42.00p -4.00p (-8.70%)
GAR 3.38p 0.00p (0.00%)
JKX 232.00p -2.30p (-0.98%)
LLOY 55.44p -1.18p (-2.08%)
LLPE 59.75p -0.25p (-0.43%)
MAI 156.00p -1.00p (-0.64%)
QQ. 128.00p -1.50p (-1.16%)
RBS 43.49p -3.24p (-6.93%)
UNG 2.75p +0.13p (+4.76%)

Listed on New York Stock Exchange:

C $3.79 -$0.17 (-4.29%)

This week's big things have the markets sent the markets up and down. First, BP's continuing problems regarding the oil spillage in the Gulf of Mexico after the top kill method fails to plug the leak. Second, Prudential's bid for AIG's Asian business fails after the US State refuses to lower the price. The revolt from it's shareholders is due to the price being too high in the current economic climate. The firm will have to pay massive fees to the advisers and a break fee to AIG leading to concerns to it's future. Thirdly, generally good company news from the US stock markets sent the UK markets up. Lastly, worse than expected US job figures have caused a classic overreaction through sell off of stocks. Lets hope for the best which it will come.

Tuesday, 1 June 2010

Can the UK withstand the assault on the pound?

I read this interesting post regarding speculative attack on the Australian dollar on the Contrarian Investors Journal. I am just wondering if the pound sterling today can take similar punishment. As of at the end of April 2010, the UK has US$71,132 million of foreign reserves (1). The exchange rate of the pound to other currencies is a floating one, unlike before Black Wednesday when the pound is pegged to the Deutsch Mark. Before I discuss in a little bit more detail about the attack on the pound, I want to go through the following points:
  • The UK imports more than it exports so it is a current account deficit country. (2)
  • Personal debt stands at £1,460 billion, which is higher than the country's GDP. (3)
  • Public sector debt is at £893.4 billion (as of April 2010). That is 62.1% of the GDP.(4)
  • UK's GDP is £1,438.6 billion (using April 2010 figures). (5)
If the speculators collectively decide to attack the pound, what are the likely steps?
  1. They borrow ten times the amount of the shorting position.
  2. They short the stock market.Then they will short the pound. 
  3. In order to make it depreciate they will have to short the amount greater than the foreign reserves the UK has.
If the attack happens, the Bank of England might let the pound depreciate up to a certain extent, for example, on par with the euro. After that they will use their foreign reserves to buy the currency to support it. 

What if the attack on the pound is too strong? The next move the Bank might take is to raise interest rates in order to make shorting expensive as possible for the attackers. Then the pain really starts in the UK economy. The following occurs in the likely order:
  1. Stock markets will fall.Real estate markets will suffer even more. Note that real estate prices started to fall when the Financial Crisis started in 2007.
  2. GDP will fall as the rest of the economy suffers as more businesses go bust so unemployment rises and the number of defaults goes up. Stagflation [combination of the two bad apples of stagnation and inflation] will occur.
  3. Risk of the UK losing its AAA status, resulting in higher interest rates for loans. That will delay the recovery even further.
Then the attackers will make profits through shorting gold and, as the only lenders in the pound, lending to those who need to borrow.

What if the Bank manages to defeat the attackers? Well, the latter will suffer huge losses on the foreign exchange but they will still make huge profits in the lending market.

Either way, the UK economy will suffer as a result of the attack on the pound. However, the extent of the suffering depends on the actions and psychology of the market participants and the effectiveness of the Bank's and the FSA's actions to stabilise the pound and the markets respectively. I believe that the pound is less vulnerable to speculative attack compared to Black Wednesday when the UK was forced to withdraw from the Exchange Rate Mechanism when George Soros attacked the pound in a spectacular way by shorting it massively.

Source:
  1. Bank of England UK International Reserves and Foreign Currency Liquidity Template retrieved on 1/6/2010.
  2. The Economist (2010), Vol. 395, No. 8684, p.102.
  3. Credit Action retrieved on 106/2010.
  4. Office of National Statistics retrieved on 1/6/2010.
  5. Office of National Statistics retrieved on 1/6/2010. Note that the GDP is obtained by dividing the public sector debt by the percentage of the GDP, that is, £893.4bn/0.621 = £1438.6bn.
Note: The picture is from OnlineForex.net.

Credit crisis of 2008

Credit crisis of 2008
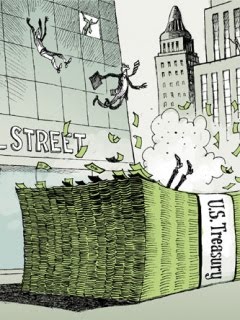
Depiction of banks receiving bailout from the state.